
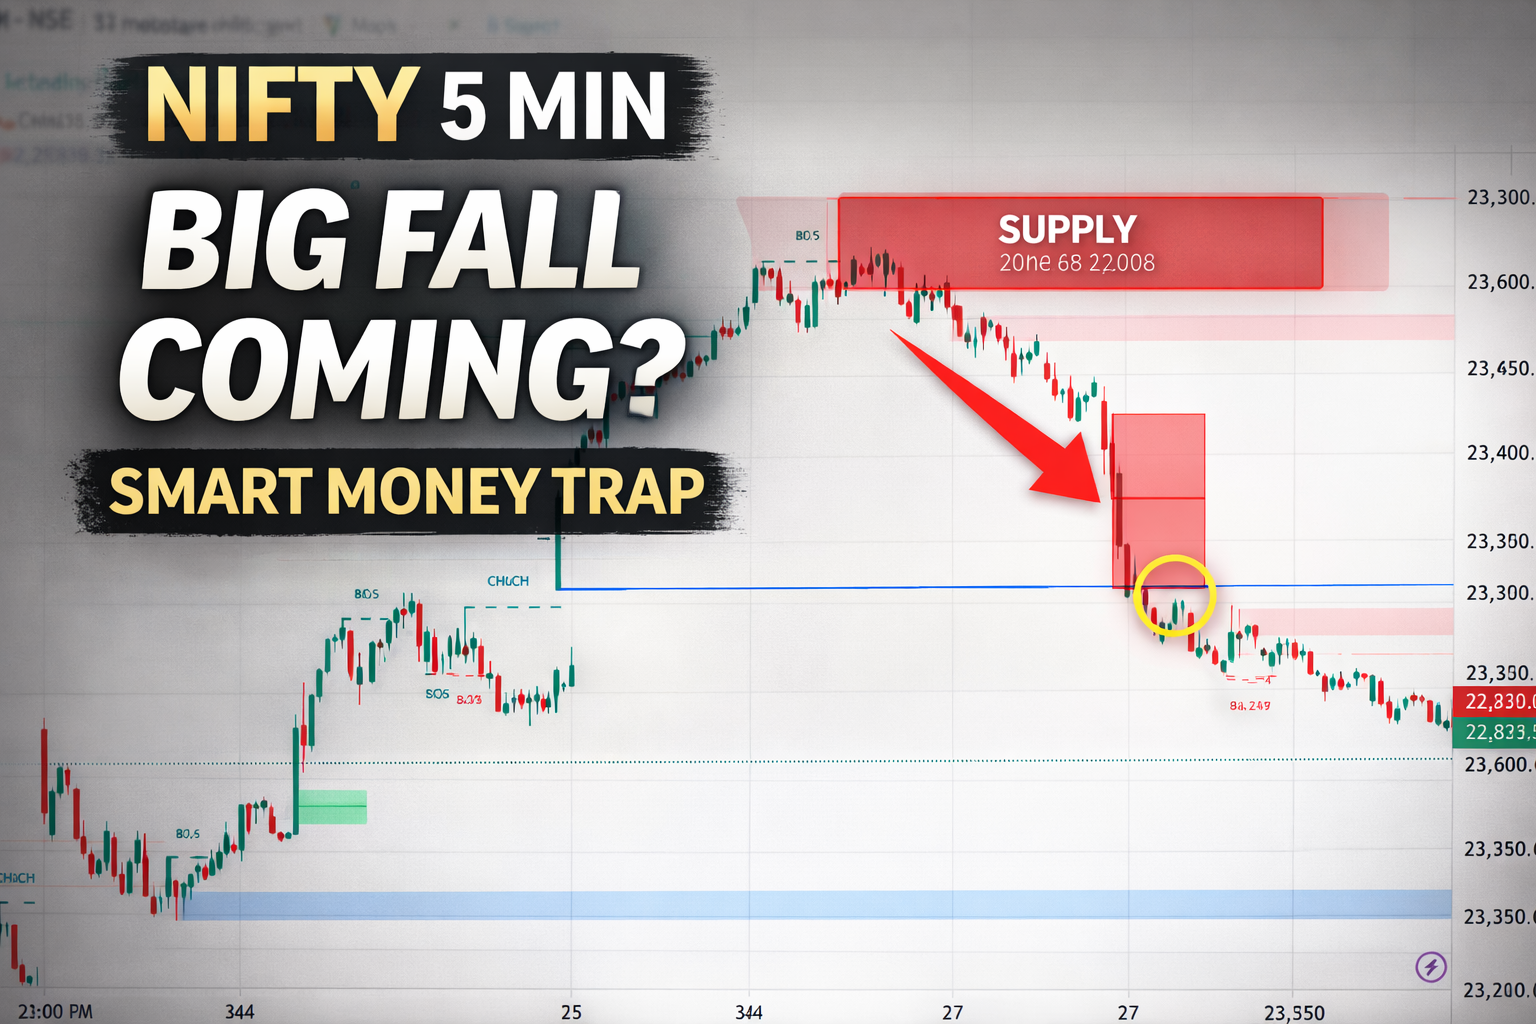
🧠 📊 Chart Overview (NIFTY – 5 Min)
👉 Current price: ~22,835
👉 Trend: Bullish → ab Bearish reversal / downtrend
👉 Concept: SMC (BOS, CHoCH, Liquidity)
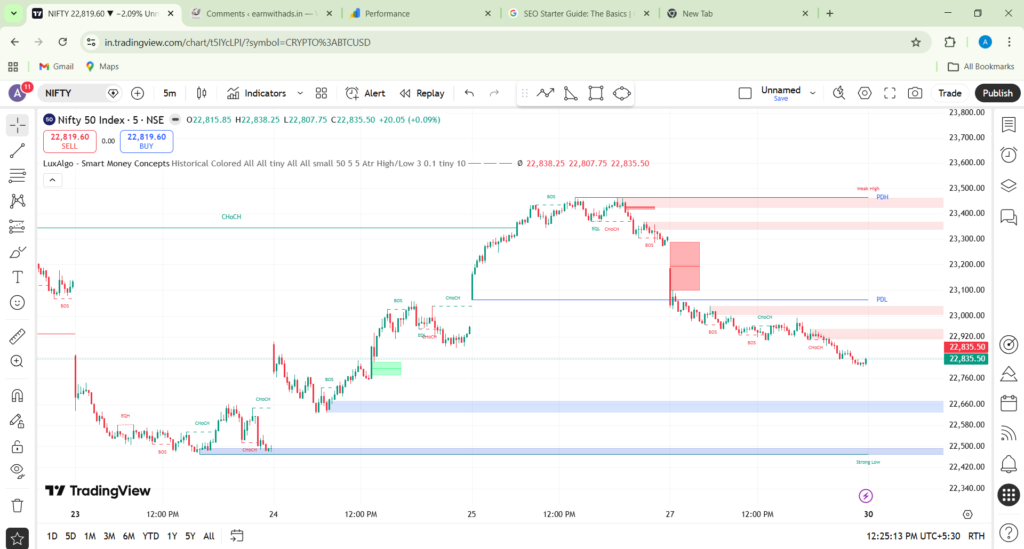
🔍 🔹 1. Market Structure (Step-by-step)
🟢 Phase 1 (Left Side)
- Downtrend tha (Lower Low, Lower High)
👉 Sellers strong the
🔄 Phase 2 (Middle)
- CHoCH aaya (trend change)
👉 Market bullish ho gaya
🟢 Phase 3 (Strong Rally)
- Multiple BOS (Break of Structure)
👉 Buyers ne full control le liya
🔴 Phase 4 (Right Side – Important 🔥)
- Top pe Weak High + Liquidity
- Uske baad CHoCH (bearish)
- Fir strong down move (BOS)
📌 Conclusion:
👉 Market ab bearish shift ho chuka hai
💥 🔹 2. BOS (Break of Structure)
👉 Chart me:
- Upar rally me BOS → bullish confirmation
- Niche aate waqt BOS → bearish confirmation
📌 Pro Insight:
👉 “Jis direction me BOS ho raha hai, wahi trend hai”
🔄 🔹 3. CHoCH (Game Changer 🔥)
👉 Top pe CHoCH dikh raha hai:
- Market ne behavior change kiya
- Bullish → Bearish
👉 Ye reversal signal tha
💰 🔹 4. Liquidity Concept
👉 Top red zone:
- Weak High (liquidity)
- Price gaya → stop loss hit kiya → reverse
👉 Middle:
- Equal highs/lows (EQL)
👉 Trap for retail traders
📌 Pro Thinking:
👉 “Market pehle liquidity leta hai, fir move karta hai”
🧱 🔹 5. Supply & Demand Zones
🔴 Supply Zone (Sell Area)
👉 23,300 – 23,450
- Yaha se market gira
- Strong selling pressure
🔵 Demand Zone (Support)
👉 23,000 (PDL)
👉 Break ho gaya ❌
🔵 Major Demand
👉 22,650 – 22,500
👉 Strong support (future reaction possible)
📉 🔹 6. Current Situation (LIVE)
👉 Abhi kya ho raha hai:
- Lower highs + lower lows
- Continuous selling
- Weak structure
📌 Conclusion:
👉 Market bearish trend me hai
🎯 🔹 7. Trade Thinking (Pro Level)
🔴 SELL BIAS (Best 🔥)
👉 Kyuki:
✔ CHoCH ho chuka hai
✔ BOS downside
✔ Demand break ho gaya
🟢 BUY (Only risky)
👉 Tabhi buy:
- Major demand (22,600 zone)
- Strong rejection mile
⚡ 🔥 SCALPING STRATEGY
👉 Steps:
- Trend = Bearish
- Pullback wait karo
- Supply zone pe sell karo
- Confirmation lo
🔴 Sell Entry Example:
👉 Entry:
22,950 – 23,000
👉 SL:
23,100
👉 TP:
22,700 / 22,600
🧠 🔹 PRO TRADER MINDSET
👉 Pro trader kya dekhta hai:
✔ Trend change kaha hua
✔ Liquidity kaha li gayi
✔ Trap kaha bana
👉 Wo kabhi:
❌ Bottom pe buy nahi karta
❌ Emotion se trade nahi karta
📝 Meta Description:
Learn NIFTY 5-minute chart analysis using Smart Money Concept (SMC) with BOS, CHoCH, liquidity zones, real trade setup, scalping strategy, and pro trader mindset.
🧾 Introduction
Stock market trading me success sirf indicators se nahi milta — asli game hai market ko samajhna. Aaj hum ek real NIFTY 5-minute chart ka deep analysis karenge using Smart Money Concept (SMC).
Ye article beginners aur intermediate traders ke liye design kiya gaya hai, jahan hum step-by-step samjhenge ki kaise market ka structure change hota hai, kaise liquidity ka use hota hai aur kaise ek perfect trade setup identify kiya jata hai.
Agar aap scalping karte hain ya intraday trader hain, to ye guide aapke liye goldmine sabit ho sakti hai.
📊 What is NIFTY & Why Traders Prefer It
NIFTY 50 India ka ek major stock index hai jo top 50 companies ko represent karta hai.
👉 Iski khas baatein:
- High liquidity
- Fast movement
- Scalping friendly
👉 Isliye professional traders NIFTY ko actively trade karte hain.
🧠 Smart Money Concept (SMC) Overview
Smart Money Concept ek advanced trading approach hai jisme:
👉 Market ko institutions ke nazariye se samjha jata hai
Iske main components:
✔ Market Structure
✔ BOS (Break of Structure)
✔ CHoCH (Change of Character)
✔ Liquidity
✔ Demand & Supply
👉 Ye strategy aapko retail traders se alag sochna sikhati hai.
🔍 Market Structure Breakdown (Chart Analysis)
Is chart me 4 major phases clearly dikhte hain:
🔻 Phase 1: Bearish Trend
- Lower High
- Lower Low
👉 Market sellers ke control me tha
🔄 Phase 2: CHoCH (Trend Change)
- Market ne apna structure change kiya
- Buyers active ho gaye
👉 Ye early reversal signal tha
🔺 Phase 3: Bullish Rally
- Multiple BOS
- Higher Highs
👉 Strong buying pressure
🔴 Phase 4: Bearish Reversal (Important)
- Top pe liquidity li gayi
- CHoCH aaya
- BOS downside
👉 Market bearish ho gaya
💥 BOS (Break of Structure)
BOS ka matlab:
👉 Jab price previous structure break karta hai
Is chart me:
- Upar rally me BOS → bullish confirmation
- Niche girte waqt BOS → bearish confirmation
👉 BOS trend ka strongest signal hota hai
🔄 CHoCH (Change of Character)
CHoCH indicate karta hai:
👉 Market apni direction change kar raha hai
Is chart me:
- Top pe CHoCH → bearish shift
👉 Ye ek warning signal tha
💰 Liquidity – Market ka Hidden Game
Liquidity wo jagah hoti hai jahan:
👉 Retail traders ke stop losses hote hain
Chart me:
🔴 Top Zone:
- Weak High
- Liquidity area
👉 Price gaya → stop loss hit → reverse
🔵 Middle:
- Equal highs/lows
👉 Retail trap
📌 Pro Insight:
👉 Market ka pattern hota hai:
Liquidity grab → Move
🧱 Demand & Supply Zones
🔴 Supply Zone (Sell Area)
👉 23,300 – 23,450
- Yaha se strong rejection mila
🔵 Demand Zone
👉 23,000 (PDL)
❌ Break ho gaya
🔵 Major Demand
👉 22,650 – 22,500
✔ Strong support
👉 Ye zones trading ke liye critical hote hain.
🎯 Real Trade Setup (Entry, SL, TP)
🔴 Sell Setup (Best)
👉 Entry:
22,950 – 23,000
👉 Stop Loss:
23,100
👉 Targets:
22,700 / 22,600
🟢 Buy Setup (Risky)
👉 Entry:
22,600 zone
👉 SL:
22,500
👉 TP:
22,900
⚡ Scalping Strategy (5 Min)
NIFTY scalping ke liye best approach:
Step-by-step:
- Trend identify karo
- Pullback ka wait karo
- Supply/Demand zone mark karo
- Confirmation candle ka wait karo
Entry Confirmation:
✔ Engulfing candle
✔ Rejection wick
✔ Momentum candle
🧠 Professional Trader Mindset
Professional trader:
✔ Patience rakhta hai
✔ Confirmation ka wait karta hai
✔ Risk manage karta hai
👉 Wo kabhi:
❌ FOMO me trade nahi leta
❌ Overtrading nahi karta
⚠️ Common Mistakes (Avoid karo)
❌ Trend ke against trade
❌ Stop loss ignore
❌ Emotional trading
❌ Random entry
💡 Risk Management Rules
✔ 1–2% risk per trade
✔ Always stop loss
✔ Capital protect karo
👉 “Capital safe to game safe”
❓ FAQs
Q1: Kya NIFTY scalping profitable hai?
👉 Haan, agar discipline follow karo
Q2: Best timeframe kya hai?
👉 5min + 15min
Q3: Indicators use kare ya nahi?
👉 SMC me indicators optional hain
🏁 Conclusion
Is NIFTY chart analysis se hume clear samajh aata hai ki:
👉 Market bullish tha → ab bearish ho gaya
👉 Liquidity top pe li gayi
👉 Downtrend continue ho sakta hai
👉 Smart traders:
- Pullback ka wait karte hain
- Supply se sell karte hain
🚀 Final Line
“Market hamesha patience ko reward karta hai, jaldi karne walon ko nahi.”
Disclaimer – i/we are not SEBI registered advisors. Yeh analysis sirf educational aur informational purpose ke liye hai. Isse kisi bhi tarah ka financial ya investment advice na samjhein. Cryptocurrency market high risk aur volatile hoti hai, jisme profit ke sath loss ka bhi pura chance hota hai. Kisi bhi trade ya investment se pehle apna khud ka research (DYOR) zarur karein aur financial advisor ki salah lena better rahega. Aapke kisi bhi profit ya loss ke liye hum zimmedar nahi honge.
https://earnwithads.in/what-skills-are-required-to-become-a-data-analyst-in-2026/
https://earnwithads.in/crypto-trading-500-rupees-guide/
https://earnwithads.in/crypto-next-level-strategy/
https://earnwithads.in/smart-money-concept-trading-explained/
https://earnwithads.in/btcusd-22-march-2-hour-timeframe-market-analytics/
https://earnwithads.in/btcusd-scalping-trade-strategy-explained/
https://earnwithads.in/xauusd-5-minute-chart-analysis-with-entry-sl-targets/